Four Decades of America's Flagship Gold Coin
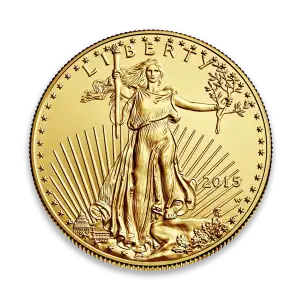
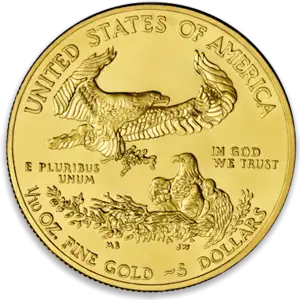
Since its debut in 1986, the American Gold Eagle has been the cornerstone of the U.S. gold bullion market. Legal tender, instantly recognizable worldwide, and struck in four convenient sizes — 1 ounce ($50 face value), ½ ounce ($25), ¼ ounce ($10), and 1/10 ounce ($5) — it gives everyday buyers an accessible path into physical gold. The coins are minted at Philadelphia and West Point in 22-karat gold: 91.67% pure gold alloyed with about 3% silver and 5.33% copper, a blend chosen to make the coins harder and more scratch-resistant than pure 24-karat metal.
The obverse carries Augustus Saint-Gaudens' celebrated 1907 Lady Liberty design, widely regarded as the most beautiful ever placed on a U.S. coin. The reverse told a different story for the coin's first 35 years: a "family of eagles" design. In mid-2021 the Mint introduced the Type 2 reverse — a striking close-up portrait of a bald eagle illustrated by Jennie Norris — along with a lightly refreshed obverse. Purity and dimensions did not change; only the artwork did.
The Complete Mintage Chart, 1986–2023
Mintage figures record how many coins of each size the U.S. Mint struck in a given year. Here is the full run from the program's launch through 2023:
| Year | 1 oz | ½ oz | ¼ oz | 1/10 oz |
|---|---|---|---|---|
| 1986 | 1,362,650 | 599,566 | 726,031 | 912,609 |
| 1987 | 1,045,500 | 131,255 | 269,255 | 580,266 |
| 1988 | 465,500 | 45,000 | 49,000 | 159,500 |
| 1989 | 415,790 | 44,829 | 81,789 | 264,790 |
| 1990 | 373,210 | 31,000 | 41,000 | 210,210 |
| 1991 | 243,100 | 24,100 | 36,100 | 165,200 |
| 1992 | 275,000 | 54,404 | 59,546 | 209,300 |
| 1993 | 480,192 | 73,324 | 71,864 | 210,709 |
| 1994 | 221,663 | 62,400 | 72,650 | 206,380 |
| 1995 | 200,636 | 53,474 | 83,752 | 223,025 |
| 1996 | 189,148 | 39,287 | 60,318 | 401,964 |
| 1997 | 664,508 | 79,605 | 108,805 | 528,515 |
| 1998 | 1,468,530 | 169,029 | 309,829 | 1,344,520 |
| 1999 | 1,505,026 | 263,013 | 564,232 | 2,750,338 |
| 2000 | 433,319 | 79,287 | 128,964 | 569,147 |
| 2001 | 143,605 | 48,047 | 71,280 | 269,147 |
| 2002 | 222,029 | 70,027 | 62,027 | 230,027 |
| 2003 | 416,032 | 79,029 | 74,029 | 245,029 |
| 2004 | 417,019 | 98,040 | 72,014 | 250,016 |
| 2005 | 356,555 | 80,023 | 72,015 | 300,043 |
| 2006 | 237,510 | 66,005 | 60,004 | 285,006 |
| 2007 | 140,016 | 47,002 | 34,004 | 190,010 |
| 2008 | 710,000 | 61,000 | 70,000 | 305,000 |
| 2009 | 1,493,000 | 110,000 | 110,000 | 270,000 |
| 2010 | 1,125,000 | 81,000 | 86,000 | 435,000 |
| 2011 | 857,000 | 70,000 | 80,000 | 350,000 |
| 2012 | 675,000 | 43,000 | 90,000 | 290,000 |
| 2013 | 758,500 | 57,000 | 114,500 | 555,000 |
| 2014 | 425,000 | 35,000 | 90,000 | 545,000 |
| 2015 | 626,500 | 75,000 | 158,000 | 980,000 |
| 2016 | 817,500 | 74,000 | 152,000 | 925,000 |
| 2017 | 228,500 | 37,000 | 64,000 | 395,000 |
| 2018 | 191,000 | 32,000 | 62,000 | 230,000 |
| 2019 | 108,000 | 30,000 | 38,000 | 195,000 |
| 2020 | 747,500 | 70,000 | 106,000 | 350,000 |
| 2021 (Type 1) | 456,500 | 31,000 | 56,000 | 150,000 |
| 2021 (Type 2) | 665,500 | 65,000 | 108,000 | 350,000 |
| 2022 | 850,000 | 75,000 | 140,000 | 575,000 |
| 2023 | 921,500 | 102,000 | 198,000 | 670,000 |
What the Numbers Reveal
Launch years were strong, then demand settled. The 1986 debut was the program's early blockbuster — over 1.36 million one-ounce coins — as collectors and investors rushed into the new American bullion coin. Output tapered through the late 1980s and stayed modest across the early 1990s, a period when gold prices were stagnant and public interest was low.
The late-1990s boom set records that still stand. In 1999 the Mint struck 1,505,026 one-ounce Gold Eagles and 2,750,338 tenth-ounce coins — the highest figures of any year in the chart. The 1998 and 1999 issues, released amid surging late-decade demand, remain among the most available Gold Eagles on the secondary market.
Crisis years spike production. The pattern is unmistakable: when fear rises, Gold Eagle output jumps. The 2008 financial crisis drove one-ounce mintage to 710,000, followed by 1,493,000 in 2009. The 2020 pandemic year brought another surge to 747,500. Gold Eagles are a safe-haven barometer — mintage spikes read like a diary of market anxiety.
The 2017–2019 lull created modern low-mintage dates. Just 108,000 one-ounce coins were struck in 2019 — the lowest full-year figure in the entire series — with the ½-ounce (30,000) and ¼-ounce (38,000) also near their floors. The lowest ½-ounce mintage of all time was 1991 at 24,100, and the lowest ¼-ounce was 2007 at 34,004. These lean years are worth knowing if you collect by date.
The Type 2 transition straddled 2021. Because the redesign landed mid-year, 2021 exists in both Type 1 (456,500 one-ounce) and Type 2 (665,500) varieties — a built-in two-year-type set that makes 2021 a favorite of date collectors.
Fractionals follow their own rhythm. The tenth-ounce coin is consistently the highest-mintage fractional — a reminder that smaller, more affordable denominations draw the broadest buyer base. In 1999, nearly 2.75 million tenth-ounce coins were struck, dwarfing the larger sizes.
Why Mintages Matter for Buyers
Mintage figures do more than satisfy curiosity. For collectors, low-mintage years can carry modest premiums over common dates, especially in high grades — a 2019 or 1991 example will typically cost more than a high-mintage 1999 of the same condition. For investors focused on gold content rather than rarity, the opposite logic applies: common-date coins from high-mintage years like 1986, 1999, or 2009 usually trade closest to their melt value plus standard premium.
Keep perspective, though. "Low mintage" for a Gold Eagle is relative — even the scarcest years number in the tens of thousands, so condition, certification, and overall demand still drive pricing more than mintage alone. Use these charts as a starting point: a way to read the history of American gold demand year by year, and a practical tool for choosing which dates to buy, hold, or hunt for.